Zero value not showing on Excel chart vertical axis - how to display ?
I have created an Excel column chart with positive and negative values on axes, but the zero value is not showing on vertical axis. Other numbers on axis are displayed correctly. How can I make also the zero value appear ?
Hi,
You can modify the showing of number values on axes by changing of number format. For example, when values on vertical axis look like this:
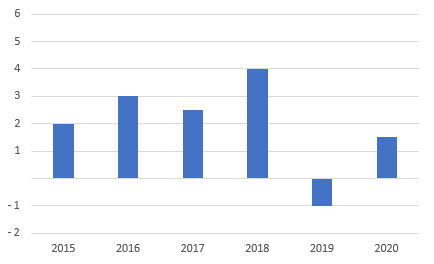
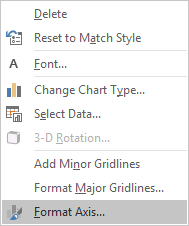
Click on vertical axis with right mouse button to display the menu and choose Format Axis:
Then in Number section, change Category, Type and enter Format Code according to your needs:
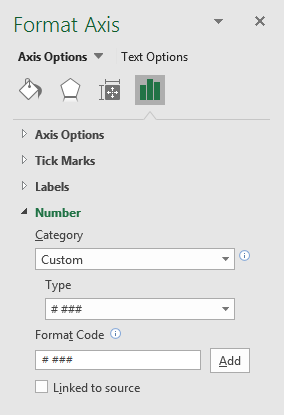
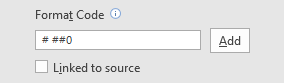
To display the zero value on vertical axis, the format code has to be changed in this case from # ### to # ##0. Save the changes by clicking on Add.
After the change of number format, the chart should look like:

You can modify the showing of number values on axes by changing of number format. For example, when values on vertical axis look like this:
Click on vertical axis with right mouse button to display the menu and choose Format Axis:
Then in Number section, change Category, Type and enter Format Code according to your needs:
To display the zero value on vertical axis, the format code has to be changed in this case from # ### to # ##0. Save the changes by clicking on Add.
After the change of number format, the chart should look like:
1 answer
Related questions
How to add side by side rows in excel pivot table ?
Is CSV excel file Comma or Semicolon separated / delimited ?
Check if value exists in column more than once or twice - Excel
How to show Euro, Dollar or Pound sign on right in Excel ?
Excel and Word menu tabs & tools in toolbars disabled / grayed out
Move excel chart horizontal axis to bottom - below negative values
Create two Charts from one Pivot table - add multiple excel charts
Invalid cell reference error in Excel vLookup function - #REF!
Read CSV and Excel files in Visual Studio - CSV viewer / editor
Download and use free Microsoft Office Excel and Word on tablet
Trending questions
Remove or hide bottom navigation bar with buttons on Android New silver underground reserves discovered ? New silver mines found ? View Instagram / X.com large photos. Original full size images. Is correct to say that something is Reset, Reseted or Resetted ? JavaScript replace match - how to use variable in regex pattern ? Get TOP and LEFT position of image element - Javascript Is PLS LCD display good ? Difference between PLS LCD and Amoled Put lost wallet in mailbox - will post office return it to owner ? Fiscal policy and Monetary policy - definition and difference Android phone soft / hard reset, master / factory reset - difference
Remove or hide bottom navigation bar with buttons on Android New silver underground reserves discovered ? New silver mines found ? View Instagram / X.com large photos. Original full size images. Is correct to say that something is Reset, Reseted or Resetted ? JavaScript replace match - how to use variable in regex pattern ? Get TOP and LEFT position of image element - Javascript Is PLS LCD display good ? Difference between PLS LCD and Amoled Put lost wallet in mailbox - will post office return it to owner ? Fiscal policy and Monetary policy - definition and difference Android phone soft / hard reset, master / factory reset - difference
2026 AnswerTabsTermsContact us